Title of Lesson:Circle Graphs
Learner Objective:
At the end of this lesson, students should be able to analyze a word problem and draw circle graphs to illustrate the data.
Do now:
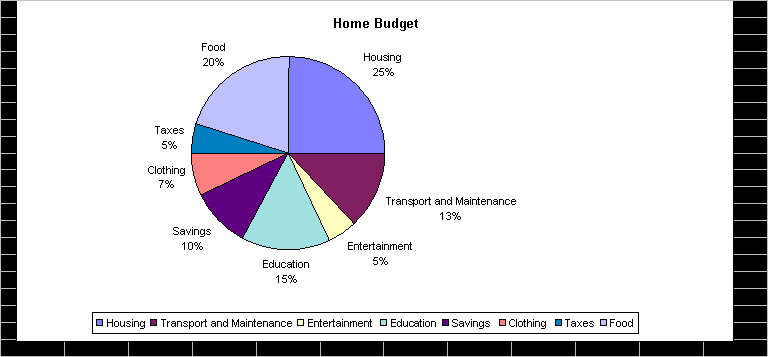
Analyze the given graph to answer the questions below:
3. Which sector of the Home Budget is the largest?.
Motivation:
How can we draw circle graphs to show "everyday" information..
What kind of information can we show in Circle graphs.
Quick Quiz:.
Circle graph shows the relationships of the parts to each other and to the total.
{True or False}
Development of the lesson:
Instruction:
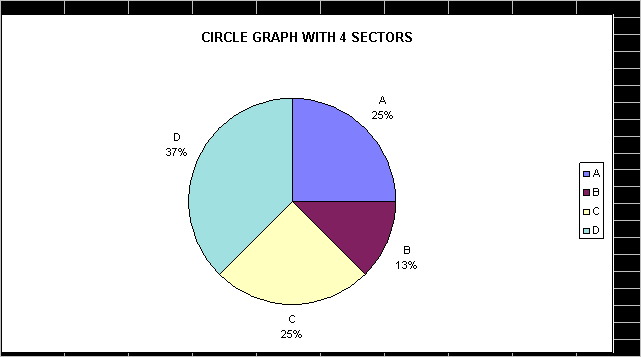
The above circle graph has 4 sectors. The measure of the angle for each sector is shown. The sum of the angles of the sectors of the circle equals 360 degrees.
To mark the sector boundaries you need to use a protractor. The protractor is used to measure the exact size of the sector.
To make a circle graph follow these steps.
Class Work (Guided Cooperative Activity)
Denise’s college expenses for one semester were $ 3,000. for tuition, $5,000. for room and board, and $ 2000. for the miscellaneous expenses.
Make circle graph to show the data.
Solution Template:
Here are the steps we need to follow in order to draw the circle graph for this problem.
Step 1) Find the total of Denise’s expenses by adding the cost of tuition, room and board, and miscellaneous expenses from the above question.
Total expenses = [Please fill in value]
Step 2) Find out what each of the expenses is with respect to the whole. (i.e. each expense divided by the total of the expenses above)
Item 1 - Tuition =
Item 2 - Room and Board =
Item 3 - Miscellaneous =
Step 3) Remember that every circle is made up of 360 degrees at the center.
Find what part of the 360 degrees each sector represents.
(A sector corresponds to an expense and the circle corresponds to the total of all expenses of Denise).
3,000 / 10,000. = X / 360 Now X= (3000/10,000)360 =
[Please calculate final value above]
[Please calculate value]
[Please calculate value]
Step 4)
Now use a compass to draw a circle.( You may use the protractor two times to draw the circle and mark the center.)
Then make use of a protractor to draw each angle.
Finally label each sector with name of the expense.
Give the graph a title that clearly indicates what the graph shows.
(use the blank sheet of paper attached for your graph).
Application:
Please follow the steps above to solve the following question.
1)Movies in town over the last six months:
|
Adventure: |
50 |
|
Science Fiction: |
20 |
|
Musicals |
30 |
Please draw a circle graph to illustrate the data above.
Home Work
Page 401, Questions 1,2 & 3
Vocabulary: Technology, Survey, Analyze, Sector
Due date: October 24, 1997
Next Lesson
Percents and Circle Graphs with percents
Dr. Mckinney JHS 265
Name:
Class :Grades 7 / 8 Date:
Teacher: N. Perera
Title of Lesson: PAM problem solving using Math manipulatives
Learner Objective:
At the end of this lesson, students will be able to analyze a word problem and solve it using the ability to recognize a pattern developed through the use of Math maiupulatives.
Do now: Draw a circle using a compass .
Motivation; Is it possible to draw a circle using a ruler. Discuss the answers.
Teacher demonstrates how a edge could be used to draw a circle. Helps to recognize the use of patterns.
Quick Quiz:.
It is possible to draw a few arcs to developa pattern inside the circle.{True or False}
Development of the lesson:
Guided Instruction:
Students will be given blocks to identify a pattern in addition
Complete the table given below,
|
1+9= |
2+8= |
3+7= |
4+6= |
5+5= |
|||
|
11+9= |
12+8= |
||||||
|
21+9= |
22+8= |
||||||
|
31+9= |
32+8= |
||||||
|
41+9= |
42+8= |
||||||
|
51+9= |
|||||||
|
61+9= |
|||||||
|
71+9= |
|||||||
|
81+9= |
|||||||
|
91+9= |
Write a sentence explaining what happens when you go down and what happens when you move to the right.
Can you predict the sum of any given number and a unit number.
Frame two questions. 1)
2)
Quick Quiz among groups using their own questions.
To make a pattern follow these steps.
1x1 = 1
11x11 = 121
. 111x111 =
1111x1111 =
11111x11111 =
111111x111111 =
1111111x1111111 =
Class Work (Guided Cooperative Activity)
Look for a pattern
2, 3, 5, 8, 12, ---. ---.- ---. - ---. -----. -----. ----.
Explain the relation between the numbers.
__________________________________________________________________________________________________________________________________________________________________________________________________________________________________________
Independent Practice:
Stacy’s grand father collects quarters. He gave her two quarters in January, three in February, five in March, eight in April, and twelve in May. If Stacy’s grandfather continues giving her quarters according to the same pattern, what is the total value of the quarters he will give her in December.
Solution Template:
|
Jan |
Feb |
Mar |
Apr |
May |
Jun |
Jul |
Aug |
Sept |
Oct |
Nov |
Dec |
|
2 |
3 |
5 |
8 |
12 |
|||||||
|
$ |
|||||||||||
Step 1) Find relation between the given numbers from the above question.
Step 2) Find out what numbers will fill the blank boxes.
Step 3) What is the value of each quarter in cents. ______________
Step 4): Total value of money coleected by Stacy in December = Number of quarters x Value of a Quarter in cents
= $ __________________
[Please calculate value]
Application:
Describe the pattern and list the next six numbers,
|
2 |
6 |
12 |
20 |
Frame a question of your own using the above pattern and try to solve it. Show your steps.
Home Work
Page
Vocabulary: Analyze, Predict, Circle
Due date: Feb ---, 1998.
Next Lesson
Patterns in multiplication, Pam Questions